


Creating effective workflow charts requires defining clear process boundaries, gathering stakeholder input, and breaking complex operations into manageable steps using standard symbols like rectangles for tasks and diamonds for decisions. Teams should assign specific roles, highlight department handoffs, and utilize modern tools such as Lucidchart or Confluence Whiteboards with strategic color coding for enhanced clarity. Regular analysis identifies bottlenecks and inefficiencies, while periodic validation through stakeholder feedback guarantees accuracy and maintains productivity gains that these structured visual guides consistently deliver.
How can organizations transform chaotic, unclear processes into streamlined operations that boost productivity and reduce errors? The answer lies in creating detailed workflow charts that serve as visual roadmaps for every team member. These powerful tools eliminate confusion, establish accountability, and reveal opportunities for improvement that might otherwise remain hidden.
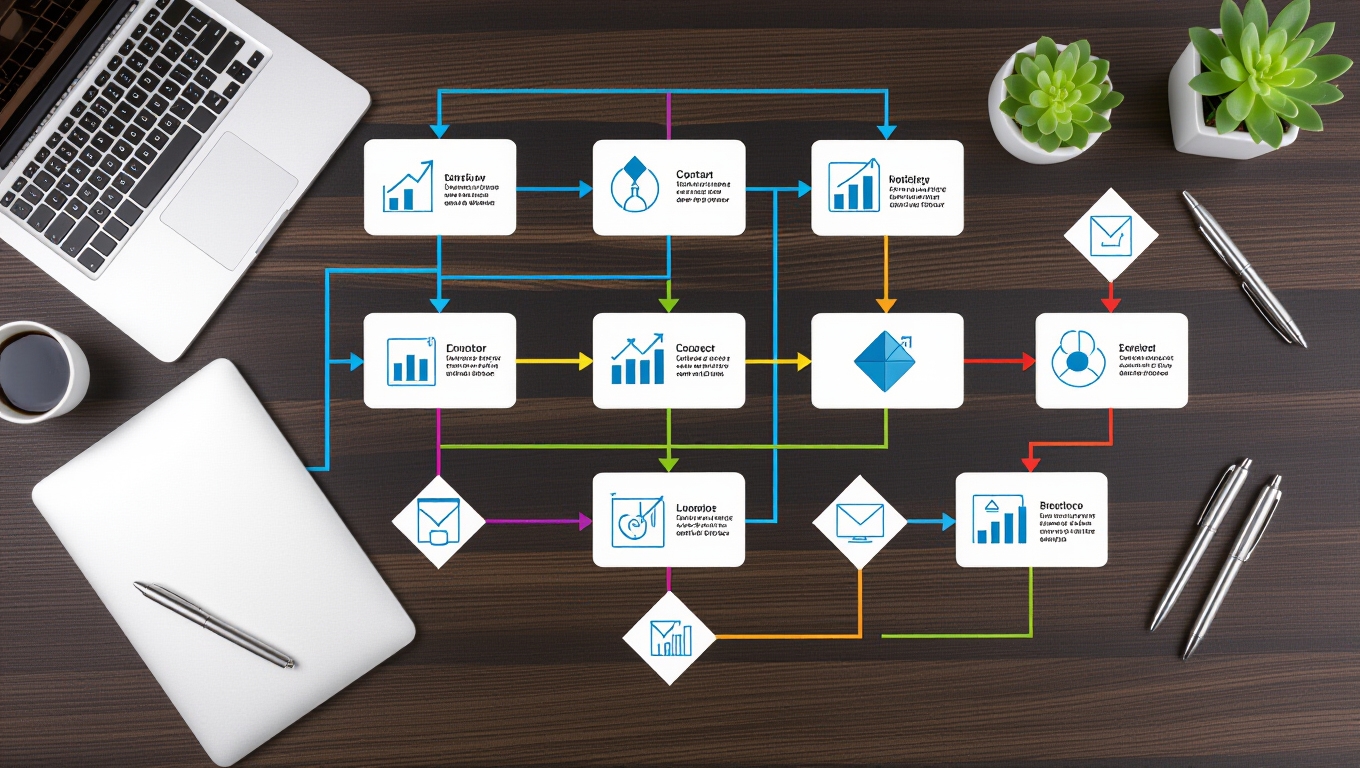
Detailed workflow charts transform chaotic processes into streamlined operations, serving as visual roadmaps that eliminate confusion and boost productivity.
The foundation of effective workflow charting begins with defining clear process boundaries. Organizations must identify the specific workflow they want to map, establishing definitive start and end points while gathering input from all stakeholders. This collaborative approach ensures that no critical steps are overlooked and that the final chart accurately represents real-world operations. Integrating these charts with document management systems can further enhance process clarity and accessibility.
Teams should list all major activities and subprocesses, clarifying the ultimate purpose behind their charting efforts.
Breaking down complex processes into individual, actionable steps transforms overwhelming procedures into manageable tasks. Each step requires clear, concise labeling using standard symbols—rectangles for tasks and diamonds for decision points. The logical sequencing from initiation to completion helps teams visualize the entire process flow while identifying parallel or conditional paths that might exist within their operations.
Successful workflow charts clearly assign roles and responsibilities to specific teams or individuals. This mapping process highlights handoffs between departments, clarifies decision-making authority, and ensures accountability remains visible throughout the entire workflow. Cross-functional collaboration requirements become apparent, enabling better coordination and communication between teams.
Modern workflow charting tools like Lucidchart, Wrike, and Confluence Whiteboards enable organizations to create professional, visually appealing charts. Clean layouts with standardized shapes, connecting arrows, and strategic color coding enhance readability and comprehension. These visual elements help teams quickly understand complex processes and identify their specific responsibilities within the larger workflow. Organizations with sequential actions can particularly benefit from workflow diagrams as outcomes often influence subsequent steps.
The creation process doesn’t end with initial drafting. Organizations must analyze their charts to identify bottlenecks, redundancies, and inefficiencies that hinder productivity. Validation through stakeholder feedback, testing simulations, and real-world walkthroughs ensures accuracy and effectiveness.
Long-term success requires proper documentation and maintenance. Storing charts in accessible locations, implementing version control, and scheduling periodic reviews keeps workflows current and relevant. Regular updates reflect changing processes while training materials help new team members quickly understand established procedures, ultimately creating more efficient, productive organizations. Swim lane diagrams enhance cross-functional process visualization by clearly displaying how different departments contribute to each workflow stage.
Frequently Asked Questions
How Often Should I Update My Workflow Chart?
Organizations should update workflow charts whenever process changes occur, such as new tools or role assignments. Regular quarterly reviews help maintain accuracy and remove outdated steps.
Fast-moving industries may require monthly updates, while stable environments need annual reviews at minimum.
Trigger updates when bottlenecks arise, organizational goals shift, or team feedback indicates inefficiencies.
Continuous improvement requires frequent iterations.
What Software Tools Work Best for Creating Workflow Charts?
Several software tools excel at creating workflow charts, each offering distinct advantages.
MockFlow provides AI-assisted diagram generation with intuitive interfaces suitable for all skill levels.
Miro specializes in real-time collaboration through online whiteboards.
Lucidchart offers advanced data linking capabilities and enterprise integrations.
SmartDraw features automatic formatting and drag-and-drop functionality.
Canva delivers elegant templates for quick design, making selection dependent on specific collaboration needs and technical requirements.
How Do I Get Team Buy-In for Following the New Workflow?
Getting team buy-in requires early involvement in workflow design and decision-making processes. Organizations should conduct workshops to gather feedback, address concerns proactively, and assign workflow champions to support peers during transitions.
Piloting new workflows with small groups before full rollout helps identify issues early. Clear communication about benefits, combined with ongoing training and leadership commitment, guarantees smoother adoption and sustained compliance across teams.
Can Workflow Charts Be Used for Personal Productivity Tasks?
Workflow charts effectively enhance personal productivity by visualizing task sequences and clarifying daily routines. They enable individuals to identify priorities, track deadlines, and spot potential bottlenecks in their personal processes.
These visual tools support mental decluttering by externalizing complex task relationships, reducing stress while improving focus. Personal workflow charts also facilitate automation of recurring activities, ultimately freeing cognitive resources for more critical responsibilities.
What’s the Difference Between Workflow Charts and Process Maps?
Workflow charts focus on sequential task execution and step-by-step processes, using simple symbols to show linear progression.
Process maps provide extensive, end-to-end visualizations that include inputs, outputs, decision points, roles, handoffs, and cross-functional dependencies.
While workflow charts excel in training and quick reference due to their simplicity, process maps serve business analysis, compliance documentation, and process improvement initiatives requiring detailed organizational context.